
How to measure event success

Ryan Campion
July 23, 2019
So you’ve decided to attend or sponsor some events. (Or if you haven’t, read this to figure out if a trade show is even worth it). But now you’re wondering how to measure event success or ROI.
Or perhaps you’re unsure of events altogether because you’re uncertain if you can even reliably measure success.
I’m here to tell you you can, and I’ll show you both the tools and methodology we use here at Printfection.
Measuring event success – the obvious KPIs
I’ll dive into the more anecdotal and “fuzzier” elements of event success in a bit, but let’s start with the easy stuff.
Most companies that attend or sponsor trade shows are after one thing – leads. And not just leads, but high quality leads that will convert to paying customers.
That most sponsorship packages come with a lead scanner or two shouldn’t surprise anyone. They make capturing lead information fairly easy.
So measuring the number of leads you receive at a show comprises a relatively simple task.
But obviously, not all leads are created equal.
The true way to measure event success is to look at the number of opportunities, pipeline, and ultimately, revenue generated.
This is where it can get more manual unless….
Enter marketing attribution software
In my opinion, leveraging an attribution tool safeguards you from spreadsheet hell or some other manual form of data wrangling when calculating event ROI.
I use Bizible.
After installing a simple line of code on your website, Bizible can identify the marketing channels that led someone to your site, or what might have spurred them to request a demo. Or any other action, for that matter.
For example, Bizible can tell you if they first found you from a Facebook ad, a LinkedIn article, searched for you organically, or clicked a link in a promotional email, etc.
Events are largely offline, with the exception that most shows offer pages showcasing the sponsors, and on those pages they can provide links back to their site.
Bizible allows you to create ‘touchpoints’ based on Salesforce campaigns, however. And that’s what I use to track our events.
I create a campaign, upload the list of leads, and then they automatically get assigned attribution.
Then, no matter when it occurs, if an opportunity is created, that particular event will receive full or partial credit, depending on whether other significant touches/campaigns influenced the deal.
Here’s an example of an attribution touchpoint on an Opp. This one was from SiriusDecisions’ US Summit we attended in Austin! (If you’re a B2B marketer, definitely worth checking out by the way).
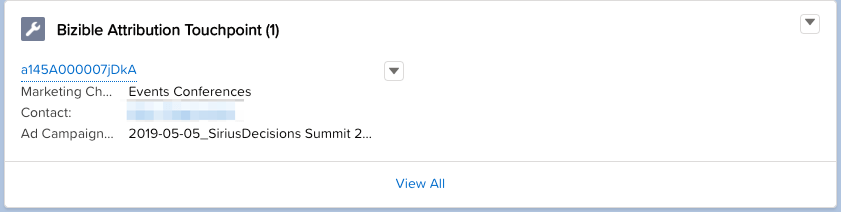
This makes it incredibly easy to ascertain how many opps and how much revenue came from a particular show.
The final step to measuring the success of your event is connecting revenue data from your closed-won opps. With Bizible and Salesforce, that’s just a matter of configuring your internal data and reports to view it.
Generating and measuring further event success
Bizible makes my life as a marketing leader unequivocally easier, but there are other solutions that help nail event follow-up, which can make the difference between ho-hum and hell-yeah results!
For this important task, we leverage Outreach.
When I upload event leads into Salesforce, I first segment them based on hot, warm, and cold statuses.
Most lead scanning vendors allow you to enter notes as you’re engaging with a prospect at your booth.
The ones we feel are most promising and want to pass immediately to sales, we mark hot.
Prospects who clearly gave us the time of day, asked thoughtful questions, or otherwise seemed like worthwhile fits, we mark as warm.
Any prospect who blows us off, or comes by so quickly we don’t even have time to converse (aka there are no notes), we mark as cold.
We then use Outreach to sequence the warms with a dedicated SDR track, which can include both emails and calls.
Depending on the number of colds and the bandwidth of our SDR team, we’ll sequence them with personalized emails. We might just leave off the call steps.
This strategy works phenomenally well, since you’ll invariably see good prospects bubble up who you just happened to miss during the peak rush at your booth.
You’ll likely notice the bulk of your opps come 1-2 months after a show.
With proper follow-up, however, you should see that trickle continue 3-4+ months post-show.
And of course, you’ll likely score the rogue deal here and there sometimes over a year after a particular conference!
Measuring impact of trade shows on your customer base
Events can generate new business, and they can absolutely accelerate existing deals.
But they can also expand new business opportunities within your existing customers.
In my last article, I explained that choosing events where your customers and competitors are already attending makes good sense.
And that’s simply because in-person interactions trump any other form of communication, and you should be getting in front of your customers wherever possible.
At Prinfection, our measurement here does fall more into the manual realm. We don’t have Bizible configured to properly capture opps post-sale.
So after the show, I run post-event reviews with our CS team to determine what new business ventures resulted from meeting with customers.
I document the associated value of the new business in the SFDC campaigns, where it remains in undying glory for all to see. 🙂
How to measure the “softer side” of events
I’m a data-driven marketer. I was a physics major in college (OK, just for one quarter —that sh*t was hard) but nothing excites me more about my job than seeing the direct connection between my efforts and our growing revenues.
Yet make no mistake, shows offer less quantifiable, yet still crucial, benefits like vaulting brand awareness and name recognition.
And going to conferences where you can be front-and-center with key prospects in addition to competitors, investors, the press, etc. gets you noticed.
One way to measure this influence is to look at Google Analytics and see if you get a measurable uptick in direct and organic traffic.
But I can feel your eyes rolling. Merely increasing traffic doesn’t necessarily equate to more revenue.
Enter Bizible again.
You can run reports which aggregate all your touchpoints by channel, which not only helps you understand which marketing campaigns are moving the needle, but allows you to spot interesting trends as well.
Like an increase in revenue related to a trade show.
Here’s a real example.
In February, we attended SaaStr Annual in San Jose. We established a unique partnership with SaaStr and did all their swag for the show.
We also helped them run their swag store where attendees could redeem “SaaStr bucks” for awesome swag items.
Printfection got a ton of recognition and shout-outs at the show, and I heard Jason Lemkin, the genius behind SaaStr, even mentioned us during one of his sessions.
The results? Big spike in organic traffic – but as the Bizible graph below shows, also revenue!
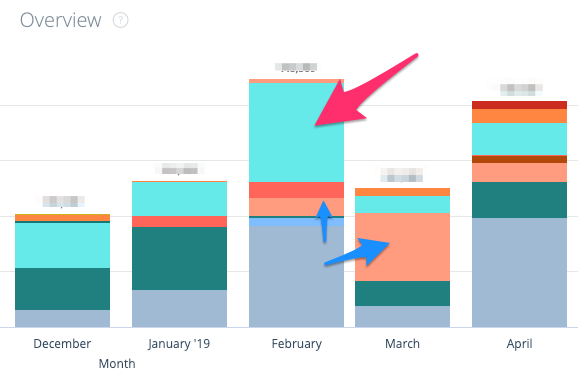
The bright pastel block in February shows revenue from deals that was influenced by organic searches. We weren’t running any other significant SEO efforts at the time, so I can infer with 99.99% confidence the uptick came from SaaStr.
In Feb and March, note the pale orange blocks — that’s revenue attributed to the events channel (in this case, also SaaStr).
So this clearly proves that brand awareness does indeed lead to more business!
Another old-school way to measure event success
I harp on Sales all the time to make sure they ask every lead how they heard about us in cases where we don’t know that information going into a call. Especially after events.
What happens? We get anywhere from 5-10 good “inbound” leads who tell us they actually first heard about us at XYZ show.
Then I simply add them to the SFDC campaign, Bizible serves them up attribution, and my pretty little bars grow larger on my chart.
And that feels great.
Other great things to measure
At our stage of growth, revenue generation is our biggest goal. But events can be useful for so much more, like:
- Did you get any major press coverage or mentions because of your participation at a show?
- Did you forge some incredibly lucrative new partnerships as a result of networking?
- Did you discover a pivot in your competitors’ overall strategy that might work to your benefit?
- Conversely, did your competitors release new features that might put you in a precarious position?
- Did you learn any new strategies or tactics your marketing/sales/CS/product teams can put into immediate action?
All of these things add up to make a big difference, and you can note them in a spreadsheet or within your SFDC campaigns.
Want to get even more bang from your buck from events?
Make sure you nail your trade show swag strategy! Check out this article and please contact us if you need help.
Finally, what approach and tools do you use to measure event ROI?
Leave a comment below!
Cool article – we measure success via attendance and NPS from attendees. Swag doesn’t help to boost these 🙂
Thank you and that’s smart to use NPS for this. You could incentivize more participation in your surveys with swag though!